Google Ads benchmarks for Ecommerce
Compare your campaigns against European ecommerce benchmarks for CPC, conversions, ROAS, and more – and learn if rising costs are your problem, or the market's.
![]() Welcome back! Your industry data is ready.
Welcome back! Your industry data is ready.
Analyze deep-funnel metrics including ROAS and conversion trends across Europe.
Data from the
full time range
Additional charts for
deeper insights
Filter the data
by Industry
Monthly Newsletter
with top trends
Data from a big amount of ad campaigns (incl. 4000+ PMax campaigns)
Built on €450M+ annual ad spend showing real market patterns
Data from a big amount of ad campaigns (incl. 4000+
PMax campaigns)
Tracks Search, Shopping and PMax shifts - always up to date
and filterable
Built on €450M+ annual ad spend showing real market patterns
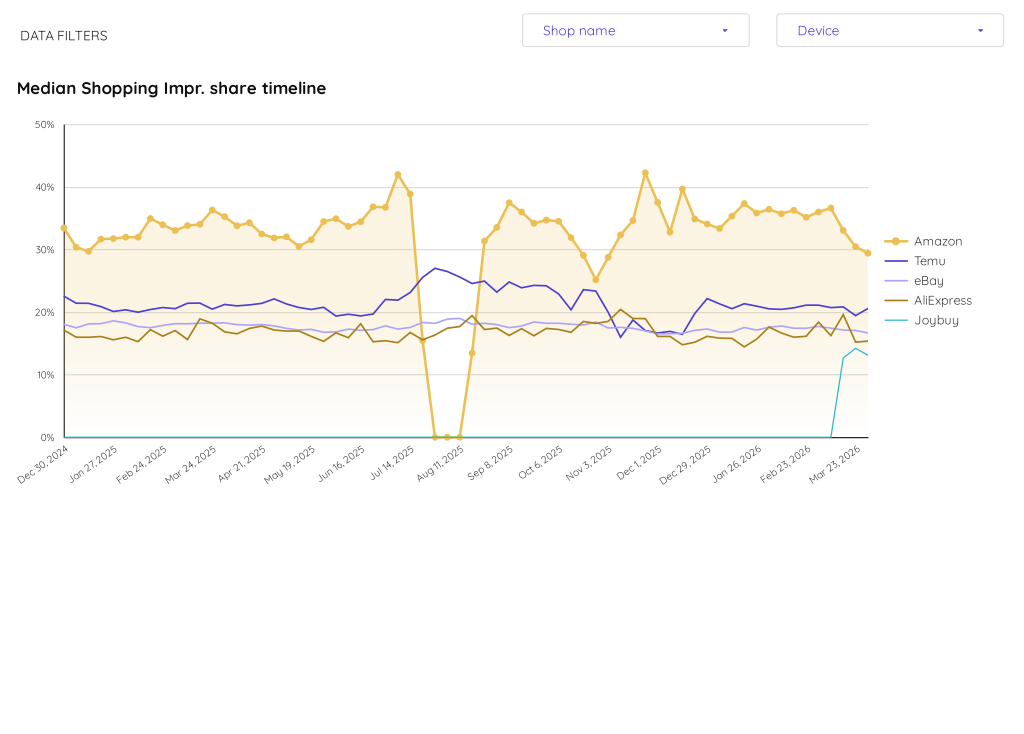
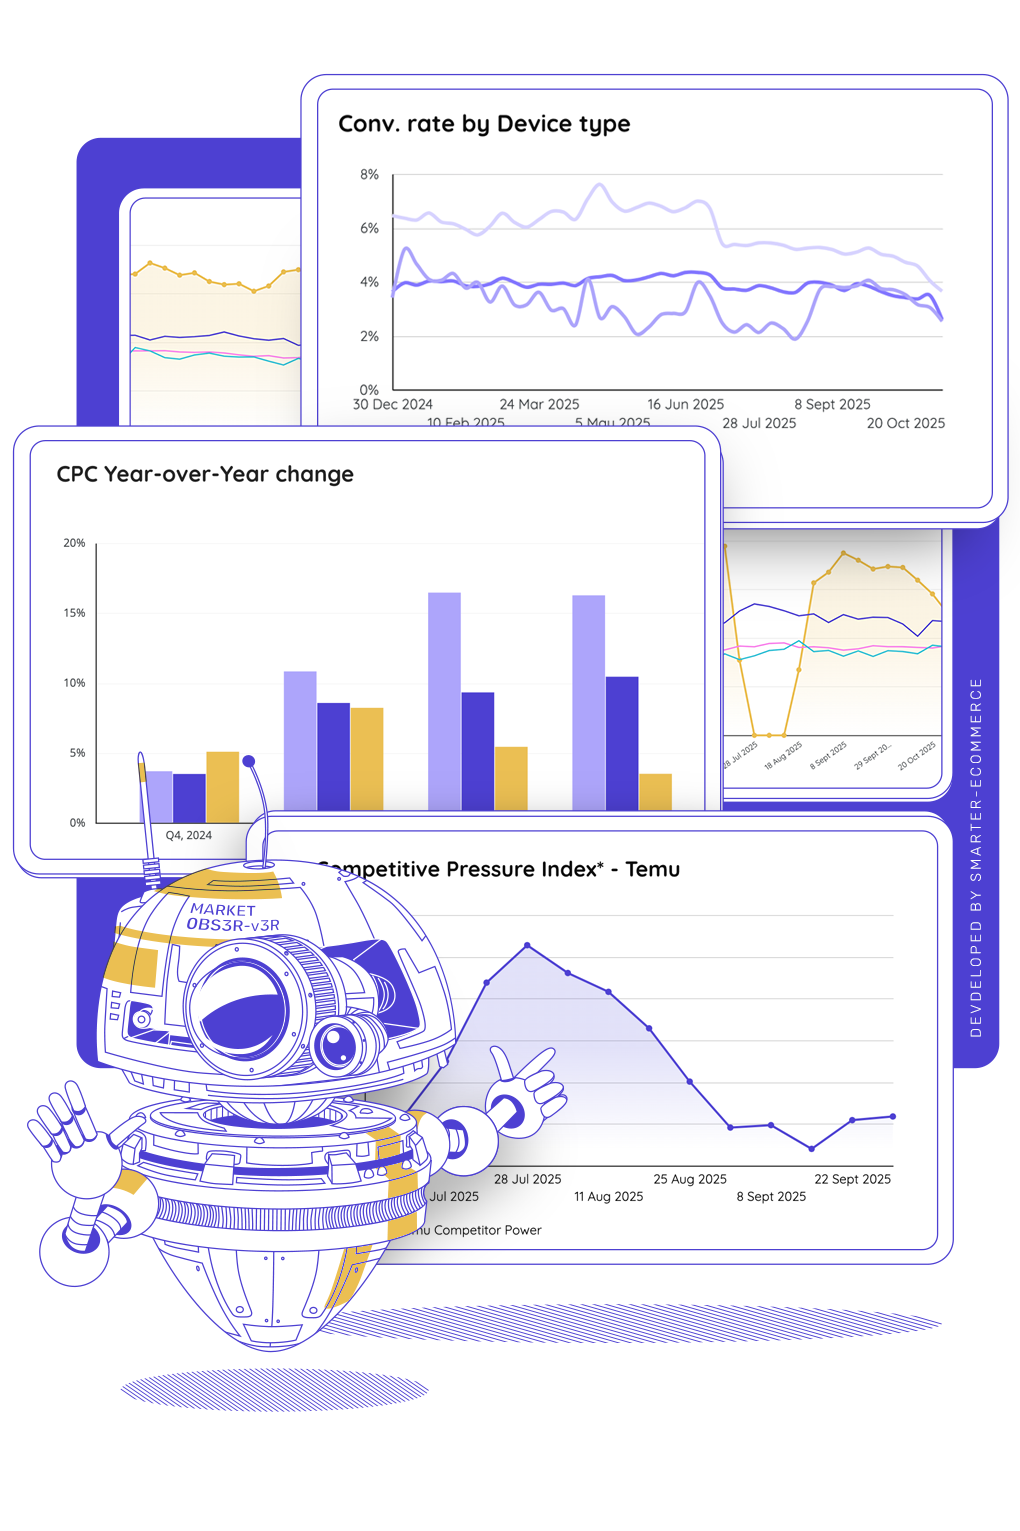
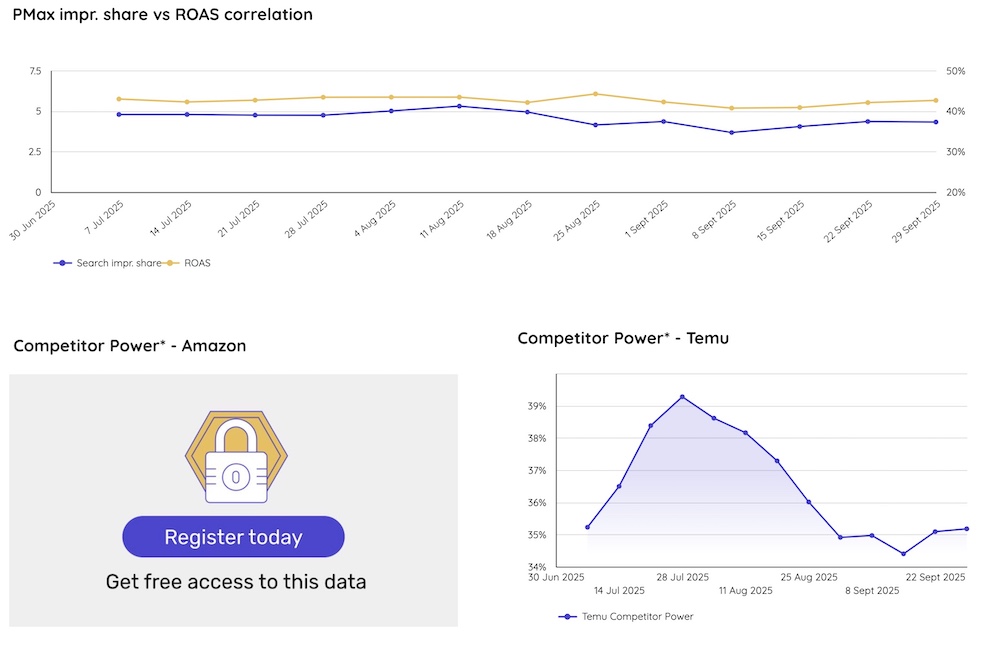
Observe movements of big auction players to stay ahead of the competition and apply adaptive strategies.
Observe the CPC dynamics in Google Ads for the Ecommerce and Retail verticals accross Europe.
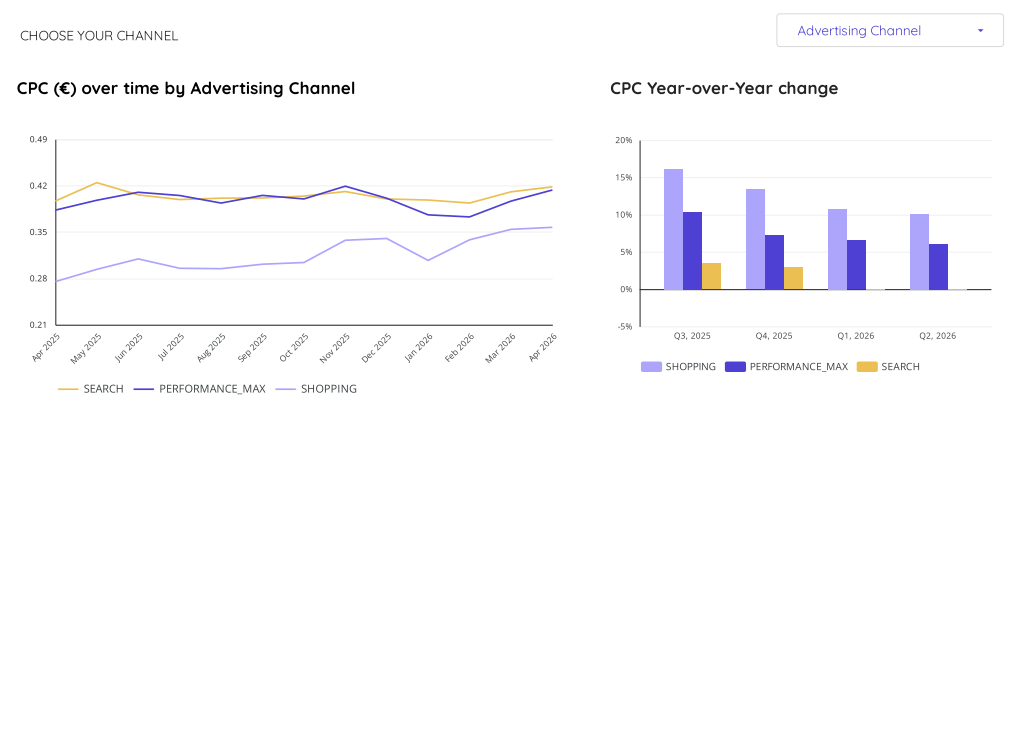

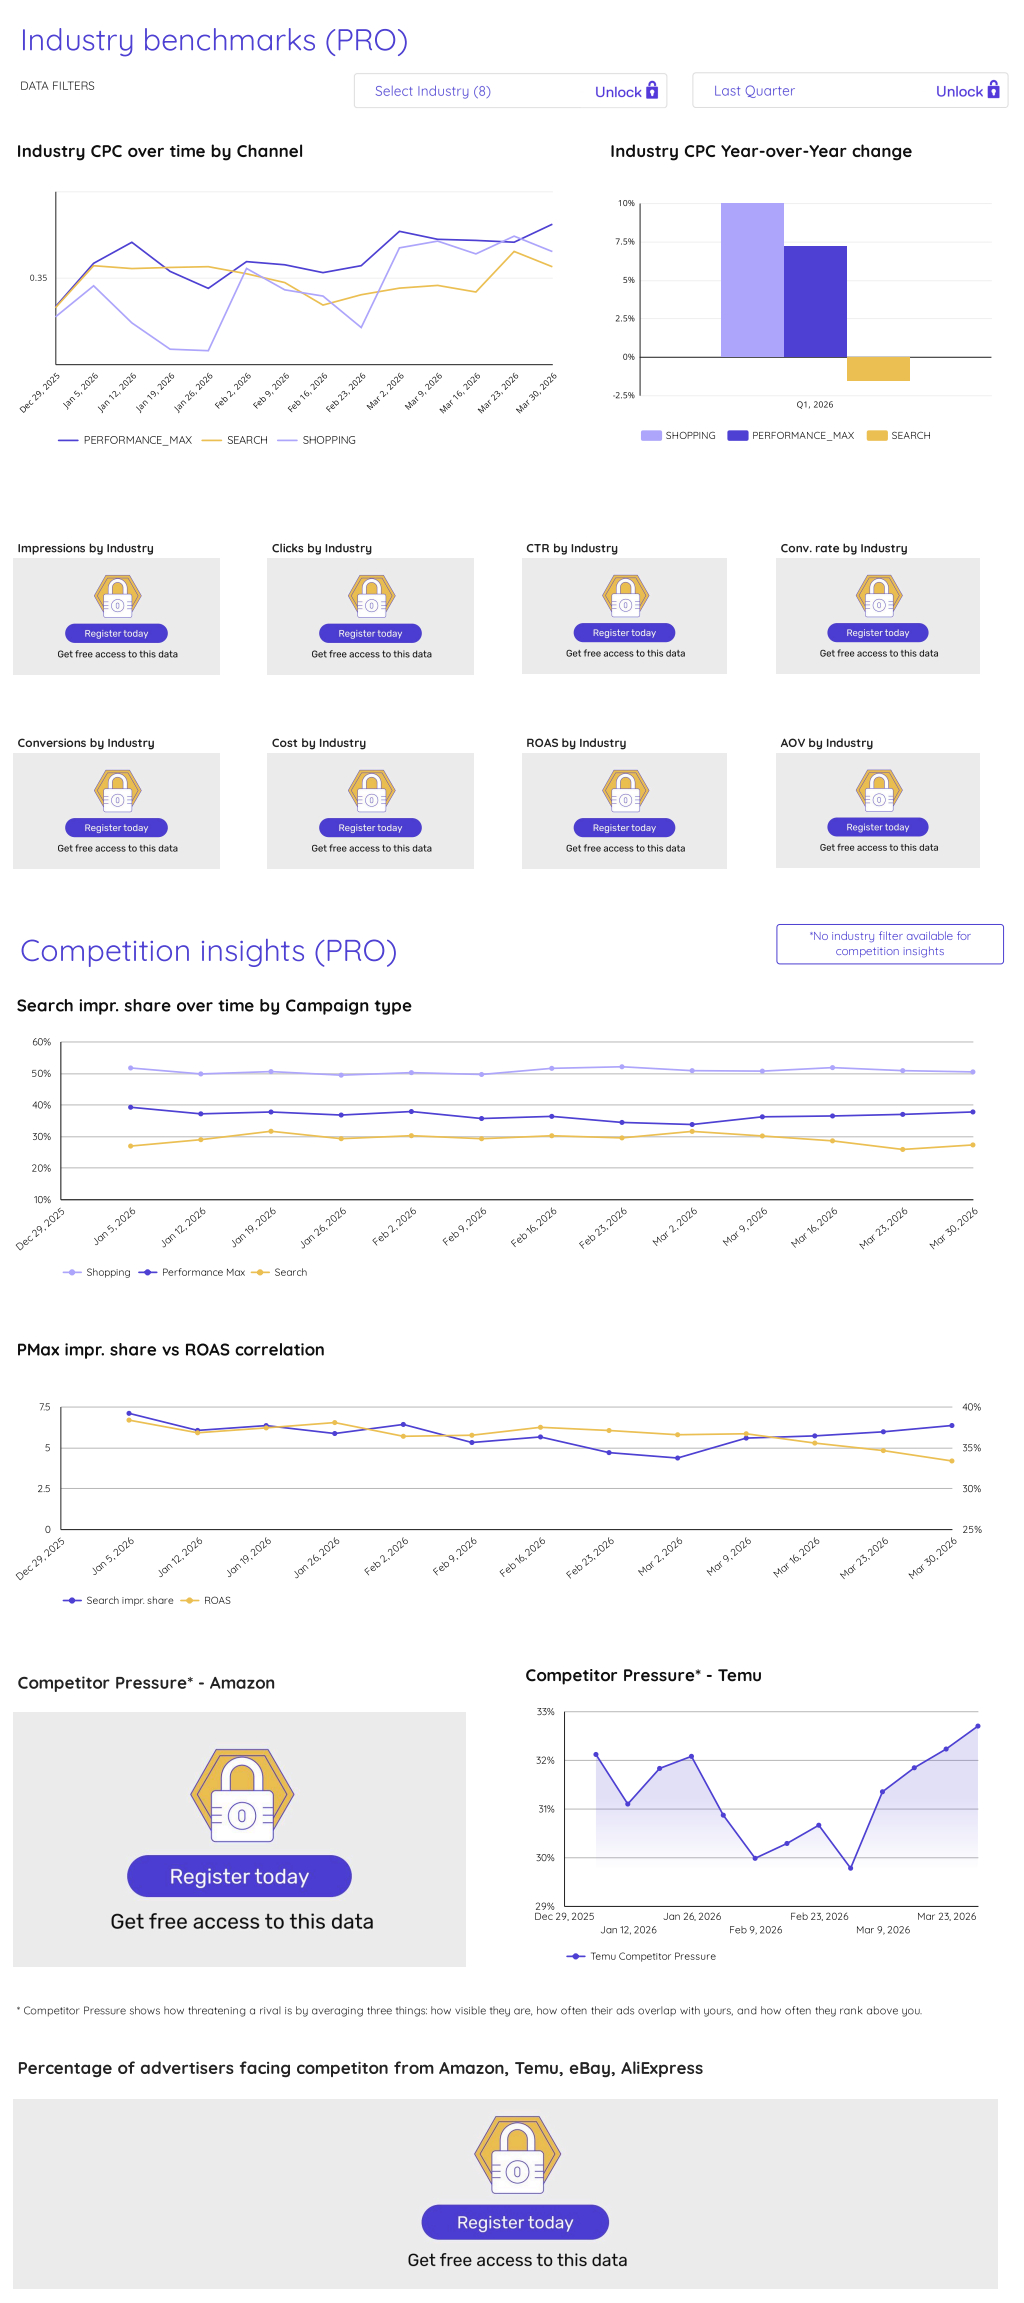
Summary
In April 2026, Search CPC rose to 0.42 euros, with Performance Max following at 0.41 euros and Shopping at 0.36 euros. During the final quarter of Q2 2026, Shopping saw a 10 percent year-over-year CPC increase. Performance Max increased by 6 percent, while Search showed a flat 0 percent year-over-year change.
Source of data:
Smarter Ecommerce
Last Updated:
April 13, 2026
Track Google Ads impressions, clicks, conversions, and cost across Search,
Shopping, and Performance Max - catch problems before they hurt your budget or identify wins to scale.
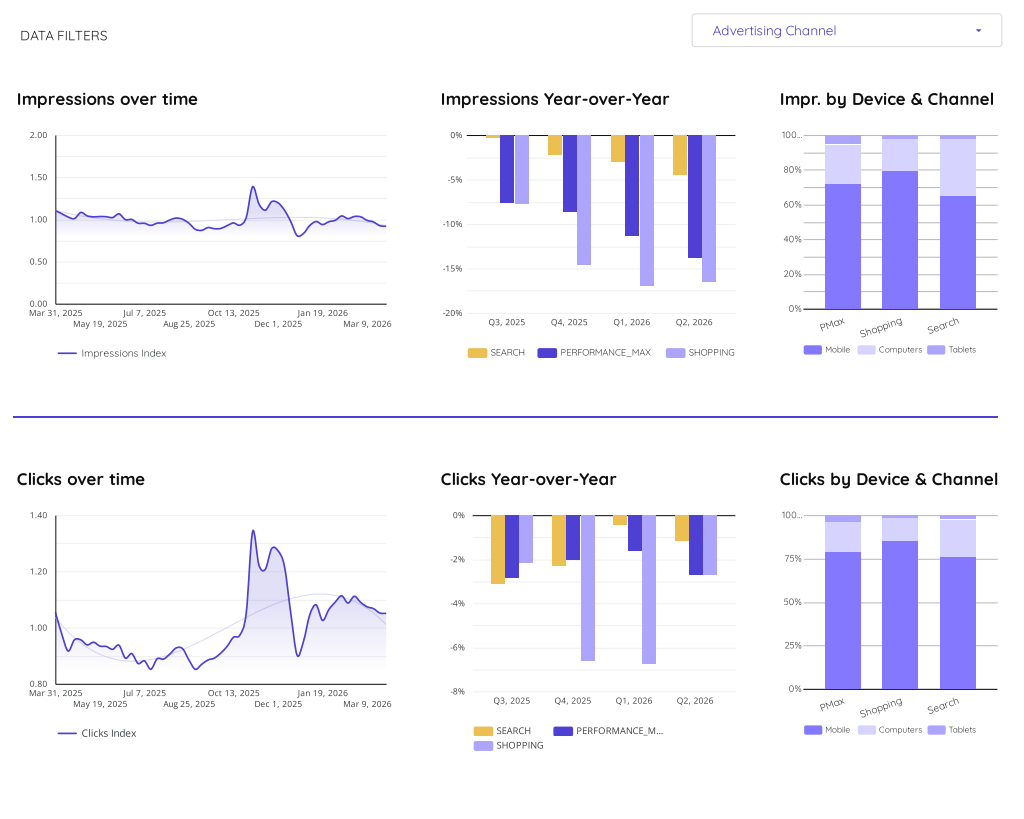
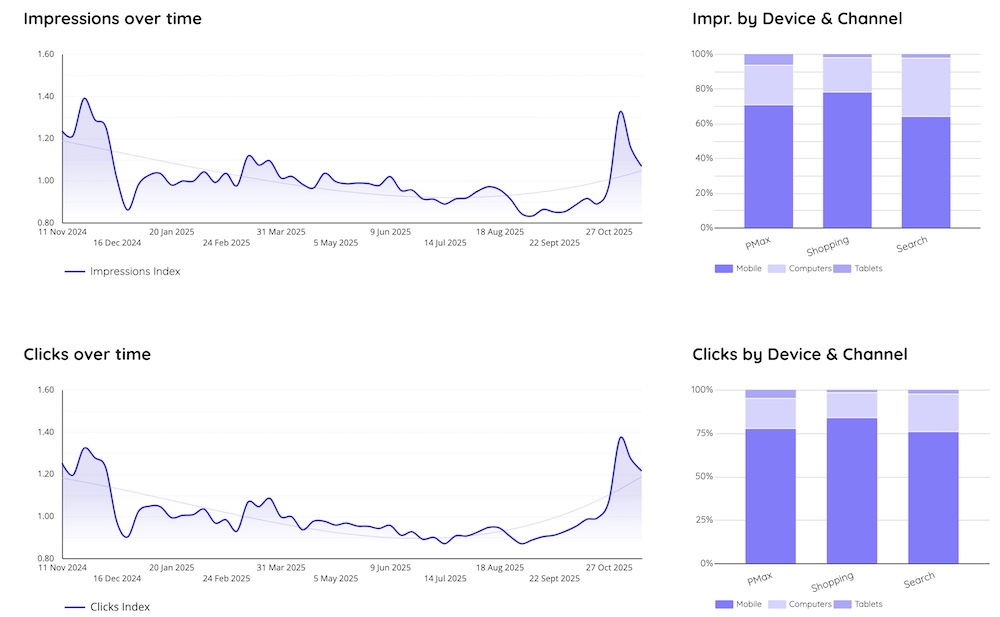
Summary
Between mid-February and mid-March 2026 both clicks and impressions exhibited a steady downward trend. During the final Q2 2026 quarter the most prominent year over year shifts were severe impression declines where Standard Shopping dropped 14 percent and Performance Max fell 11 percent compared to a milder 4 percent decrease for Search.
Source of data:
Smarter Ecommerce
Last Updated:
April 13, 2026
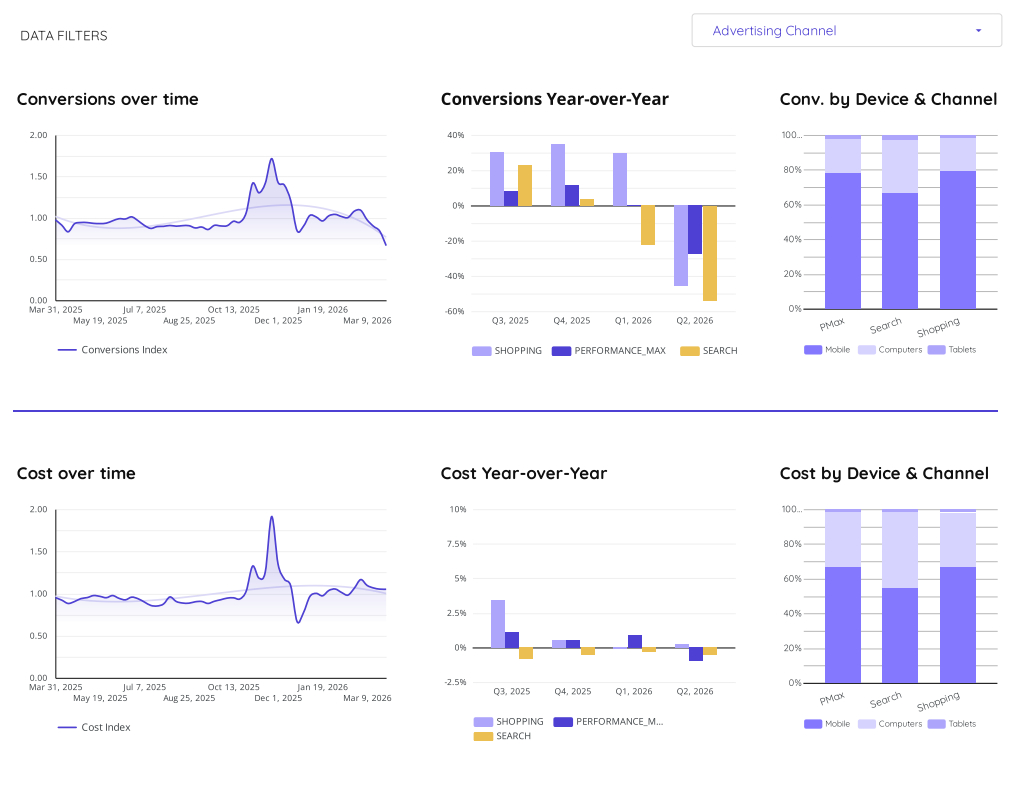
Summary
In March 2026, conversions sharply declined while costs remained stable. During Q2 2026, year-over-year conversions saw prominent drops of -38% for Search, -28% for Shopping, and -12% for Performance Max. Conversely, Q2 2026 year-over-year costs barely shifted, with Shopping and Performance Max at 1% and Search at -1%.
Source of data:
Smarter Ecommerce
Last Updated:
April 13, 2026
Monitor CTR, conversion rates, ROAS, and AOV by campaign type and device and see which channels
drive profitable growth and where efficiency is slipping.
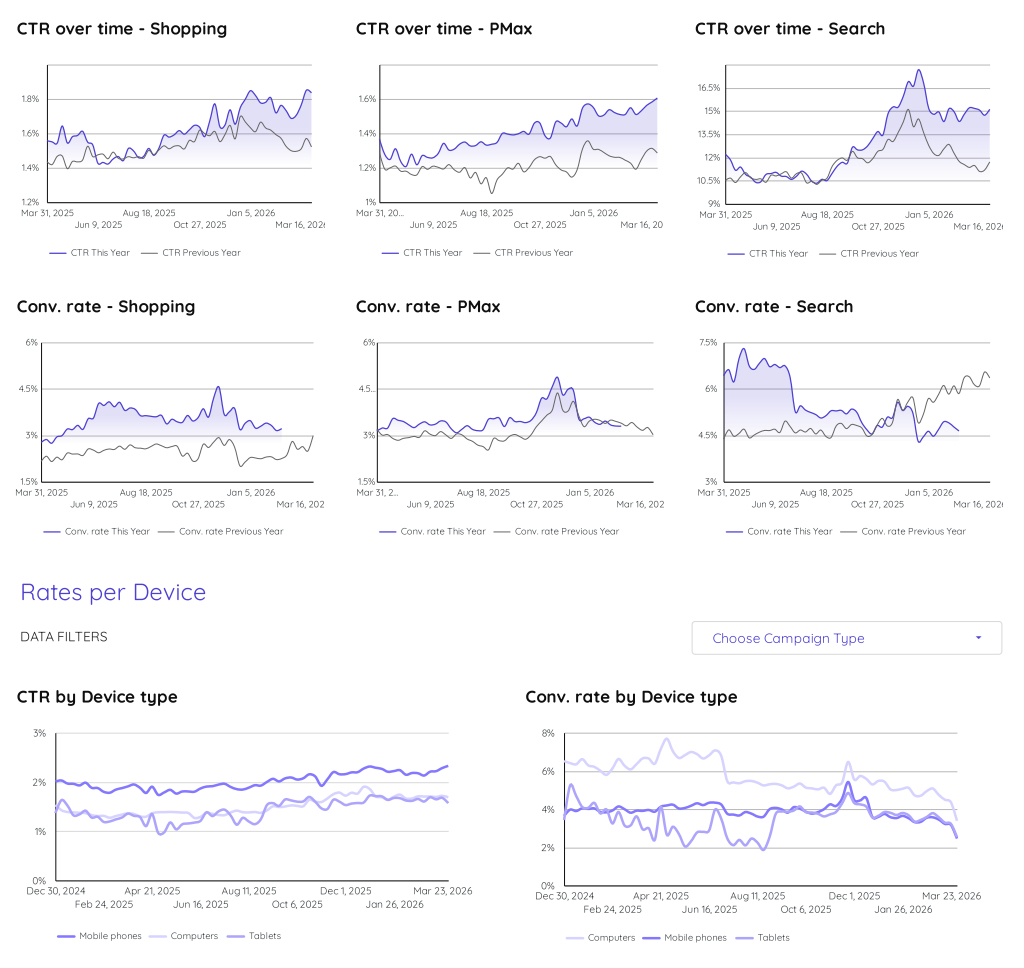
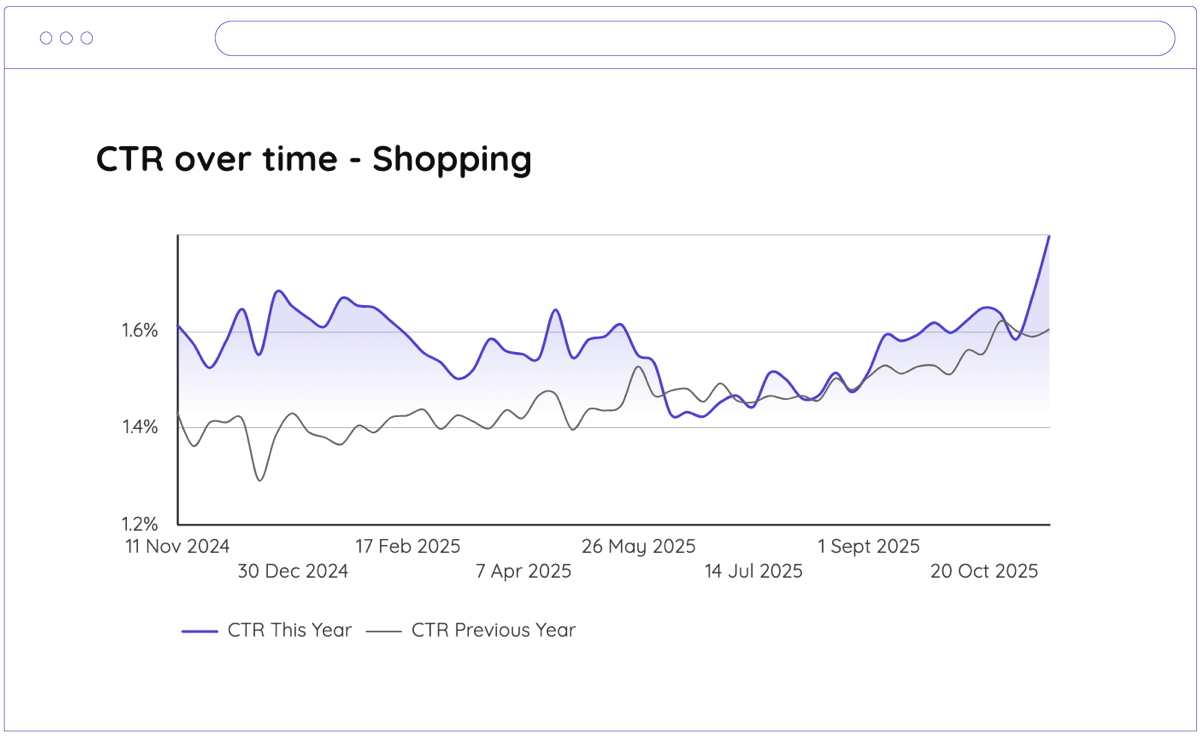
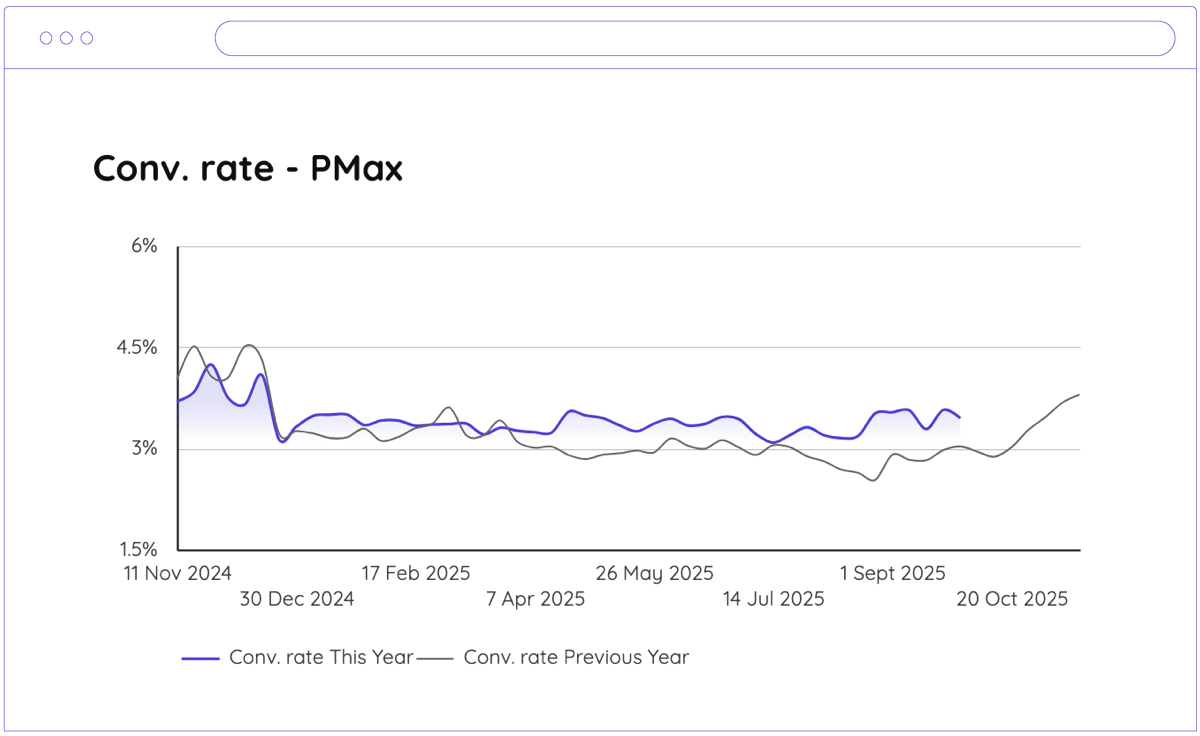
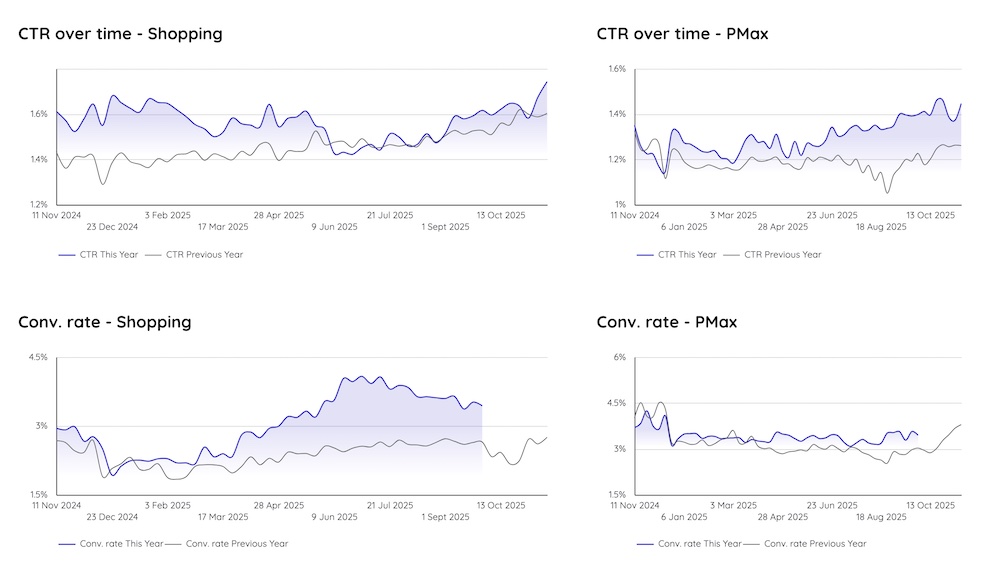
Summary
In the final month Search CTR maintained a strong lead ending at roughly 15 percent compared to the previous year at 12 percent. Conversely Search conversion rates dropped significantly to near 4.5 percent while the previous year climbed to approximately 6.5 percent. Additionally mobile conversion rates experienced a sharp decline falling to roughly 2.5 percent.
Source of data:
Smarter Ecommerce
Last Updated:
April 13, 2026
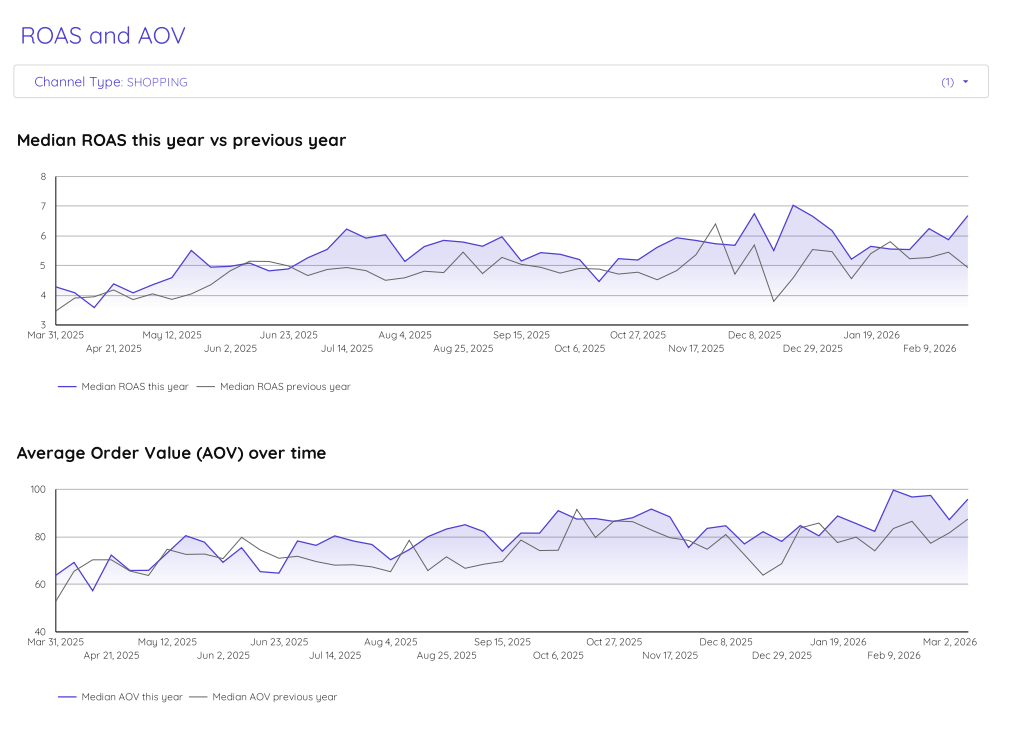
Summary
In the final month, current median ROAS peaked at approximately 6.7, significantly outperforming the previous year's 5.0, before settling near 5.5. Simultaneously, current Average Order Value experienced a prominent spike to roughly 103, creating a substantial year-over-year gap of 18 compared to the previous year's 85, before both metrics converged at the period's end.
Source of data:
Smarter Ecommerce
Last Updated:
April 13, 2026
Register for FREE full access on the PRO charts below, including industry benchmarks & competition insights.
The data allows you to observe year-over-year trends, helping you anticipate and prepare for shifts in the broader advertising landscape. This foresight can be crucial in maintaining consistent performance.
Avoid pitfalls: detect issues, such as rising costs or declining click-through rates. Recognizing these early helps you pivot your strategy before it impacts your performance significantly.
Curious about PMax vs Standard Shopping performance in the trends? We’ve got it!
Use the data to make informed decisions that improve your overall Google Ads strategy. Whether it’s optimizing for better click-through rates or adjusting your cost per conversion, these insights help you stay competitive in a crowded marketplace.
💡 Example: Year-over-year comparisons help you understand consumer behaviour and prepare for unexpected peak times, ready to allocate budget when time comes.
Data from the
full time range
Additional charts for
deeper insights
Filter the data
by Industry
Monthly Newsletter
with top trends
We take your privacy seriously. Read our privacy policy.
The Market Observer analyzes data from €450M+ annual retail ad spend across Europe, covering thousands of active Google Ads campaigns. Industry verticals include Fashion, Electronics, Home & Garden, Health & Beauty, Sporting Goods, and more—giving you relevant benchmarks for ecommerce performance.
We refresh the data every week, so you're always seeing current market trends, not outdated snapshots. Weekly updates ensure you can spot shifts in CPCs, conversion rates, and competitive activity before they significantly impact your campaigns.
We track Search, Shopping, and Performance Max campaigns separately, so you can compare performance across all three channels and understand which delivers the best results for your goals.
smec’s benchmark tool helps you make smarter, faster Google Ads decisions by showing whether performance changes are campaign issues you control or market-wide trends you need to adapt to. Here's how to use the data:
a. Benchmark your Google Ads performance against Industry standards
Compare your Google Ads metrics like CPC (cost-per-click), CTR (click-through rate), conversion rates, ROAS (return on ad spend), and AOV (average order value) to European ecommerce benchmarks. If your metrics are below average, you know where to focus optimization efforts.
b. Diagnose Google Ads Problems Faster with Market Context
When conversion rates or ROAS drop, check if smec’s benchmark tool shows the same decline across Search, Shopping, and Performance Max campaigns. If yes, it's likely due to larger forces like seasonality, competitive pressure, or changes in demand – adjust expectations and strategy. If no, it's likely a campaign-specific issue – audit Google Ads search terms, landing pages, bids or assets.
c. Contextualize Google Ads budget decisions to Stakeholders
Use smec’s benchmark tool data in Google Ads performance reports to show that, for example, rising CPCs or declining ROAS aren't isolated to your campaigns when the entire ecommerce market is experiencing the same trends. This turns defensive conversations into strategic planning backed by real benchmarks.
d. Identify Google Ads Budget Reallocation Opportunities
If you're underperforming a growing channel, there could be a chance to invest more. Looking at your CPC development compared to the markets could help get a first idea of whether you can do so profitably.
e. Plan Google Ads Seasonal Adjustments Proactively
Look at past data in smec's benchmark trends to anticipate Google Ads CPC spikes, conversion rate changes, or impression share shifts during peak retail periods (Black Friday, Q4). Adjust budgets and ROAS targets ahead of time instead of reacting after the fact.
f. Validate Google Ads optimization impact
After making Google Ads campaign changes, like refreshing ad creative, updating landing pages, or adjusting bid strategies, compare your performance trends to our tool’s benchmarks over the following weeks. If you're closing the gap or outperforming, it’s an indicator that your optimizations were effective, and are not merely due to market changes. If not, try different tactics.
Core metrics like CPC trends, funnel data, and median Google Shopping impr. share are completely free with no signup required. To unlock industry-specific filtering (Fashion, Electronics, etc.) and full historical data, register for PRO access above. It's free to sign up.
Absolutely. You're free to reference Market Observer data in internal reports, client presentations, or strategy decks. Just credit smec as the source when sharing externally.
Google provides benchmarks, but they're often generic and limited. The Market Observer focuses specifically on ecommerce and retail with deeper competitive insights, like Amazon's impression share and Performance Max efficiency trends, that Google doesn't surface in their dashboards.
We're constantly expanding vertical coverage. If your industry isn't available yet, register for PRO anyway, we'll notify you when we add your vertical, and the core market-wide metrics are still valuable for spotting broader trends.
Yes. Core funnel and performance metrics, median Shopping impr. share, and market trends are 100% free with no credit card required. PRO features (industry filtering, extended historical range, additional charts) require a simple registration, but it's still free.
This tool is built for PPC managers optimizing Google Ads campaigns, marketing managers justifying ad budgets to leadership, agency professionals benchmarking client performance, and ecommerce/retail executives making strategic decisions based on competitive intelligence.
We've crunched the numbers based on nearly two thousand Google Ads accounts for ecommerce.
A Q4 2025 analysis of over €650M in European ad spend across Search, Shopping, and PMax to reveal where performance is heading.
A Q1 2026 analysis of over €650M in European ad spend across Search, Shopping, and PMax to reveal where performance is heading.